Most of us have had our eyes tested, our teeth checked and our blood pressure taken. Very few of us have ever looked at how our brain is working. QEEG brain mapping is one of the simplest ways to do that. It is quiet and non-invasive, and it measures something your brain is already doing every second of the day.
What an EEG records
Your brain cells communicate electrically. When large groups of them fire together they produce rhythms, or brainwaves, that are strong enough to be picked up by sensors resting on the scalp. An electroencephalogram (EEG) records those rhythms. The technique is a century old: the first human EEG was recorded in the 1920s, and EEG is still used in hospitals every day.
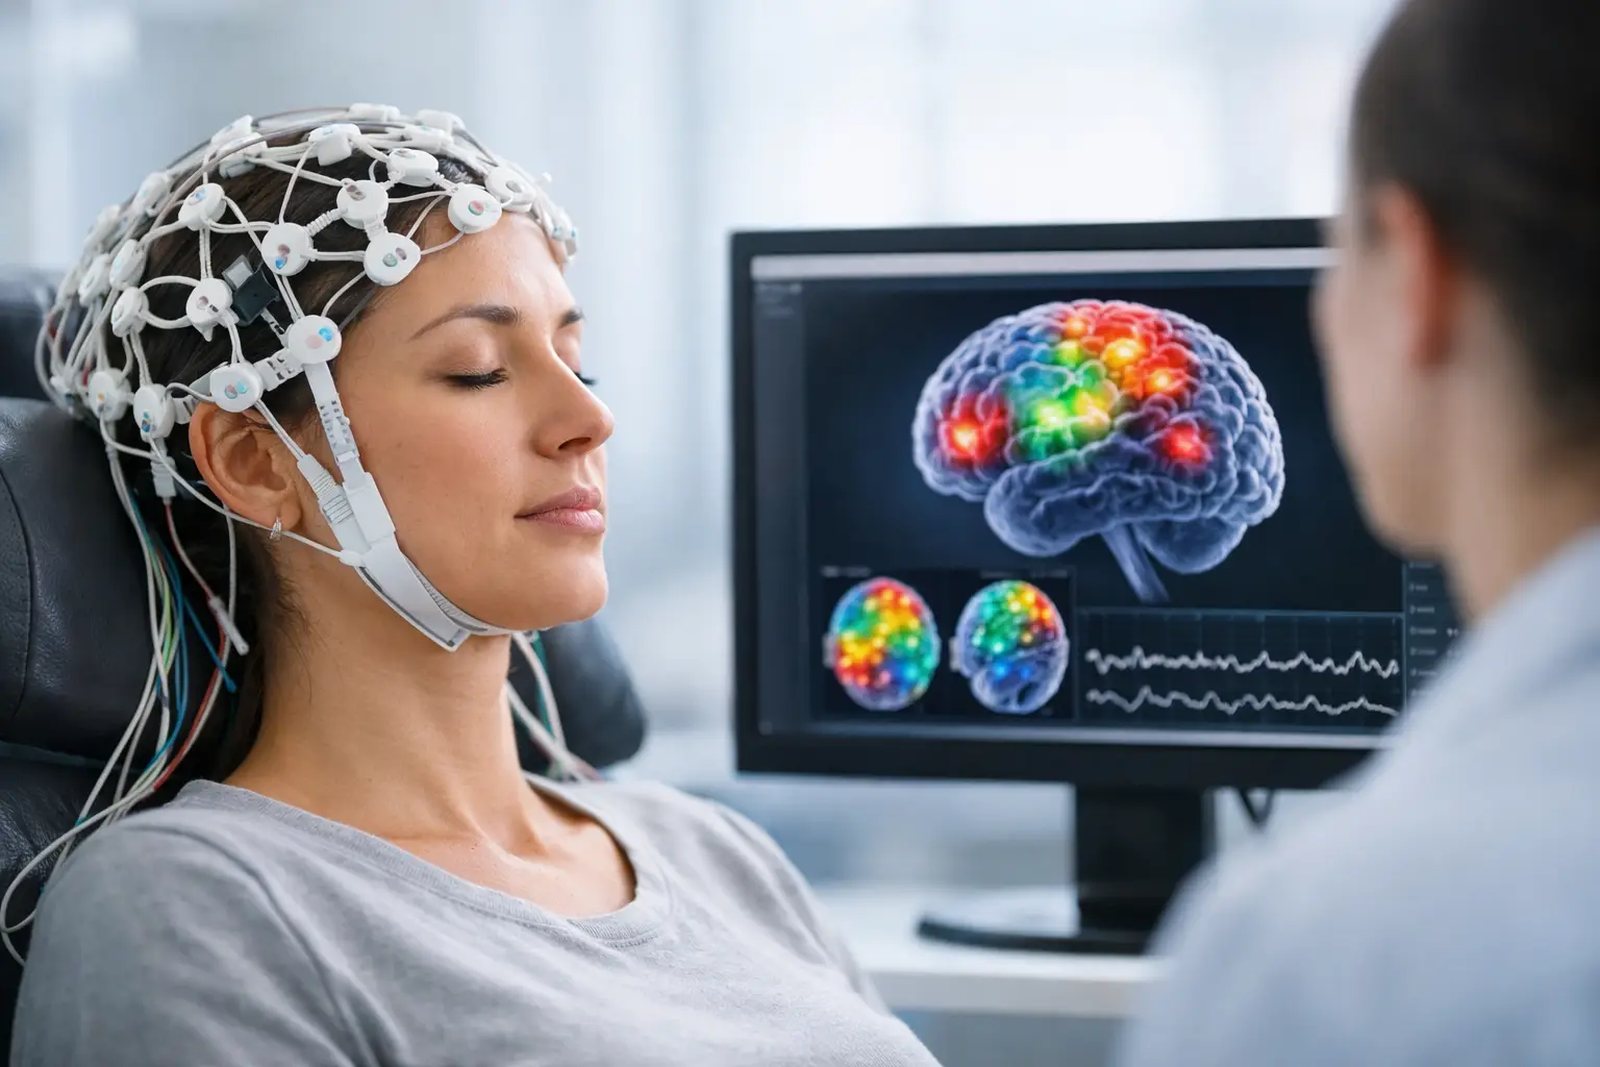
The important point is that an EEG only listens. Nothing is sent into the body. There is no radiation and no sedation, and you won’t feel anything except the cap on your head.
What makes it “quantitative”
A standard clinical EEG is read by eye, usually to look for things like seizure activity. A quantitative EEG (QEEG) goes further. The recording is digitised and analysed mathematically, site by site across the head, and the results are compared against a normative database of people of a similar age.
That comparison is what turns raw squiggles into a map. It shows where activity sits above or below what would typically be expected, and the colour-coded head images are the “map” people talk about. The analysis typically looks at:
- Power: how much activity there is in each frequency band at each location.
- Ratios: how the bands relate to one another, for example slow-wave against fast-wave activity.
- Symmetry: whether the left and right sides of the brain are working in balance.
- Connectivity: how well different regions are communicating with each other.
The brainwave bands, briefly
Brainwaves are grouped by speed, measured in cycles per second (hertz). Exact boundaries vary a little between systems, but broadly:
- Delta (roughly 1–4 Hz): the slowest rhythm, dominant in deep sleep.
- Theta (roughly 4–8 Hz): drowsiness and the drift towards sleep. Too much while awake is often linked to a foggy, slowed-down feeling.
- Alpha (roughly 8–12 Hz): calm, relaxed wakefulness, especially with the eyes closed.
- Beta (roughly 12–25 Hz): active, engaged thinking.
- High beta (roughly 25–30 Hz): intense mental effort. When it runs high it is often associated with tension, rumination and difficulty switching off.
- Gamma (above roughly 30 Hz): fast activity involved in integrating information.
None of these is “good” or “bad” on its own. What matters is the pattern: where each rhythm appears, how strong it is, and whether it fits what your brain is meant to be doing at the time.
What the session is like
At Ten Harley Street, a trained technician fits a gel-free sensor cap and checks each contact. You sit comfortably in a quiet room, with your eyes open for part of the recording and closed for the rest. Many people find the hour relaxing. You can go straight back to your day afterwards.
What you get afterwards
Your recording is processed and reviewed by our specialist team. The core QEEG report is typically around 17 pages. An extended version of up to 60 pages is available if you would like it shared with your neurologist or psychiatrist. Alongside it you receive a plain-English summary of what we found and what we recommend.
Then comes the part that matters most: a 45–60 minute review in which a specialist walks you through the map and explains what is overactive, what is underperforming, and how it connects to what brought you to us. If you want it, that review is also where your treatment protocol is put together.
Where mapping fits in your journey
You don’t start with the map. You start with a free, 20-minute Zoom consultation. If mapping looks right, the next step is the Pre Brain Mapping Assessment (£195, on Zoom), which gathers the history that gives your results meaning. Stage Two is the Comprehensive Brain Mapping Analysis: £595 for the mapping session, and £295 for the review and treatment protocol at Harley Street, or £890 for both.
Sources
- Coburn KL et al. (2006). The value of quantitative electroencephalography in clinical psychiatry: a report by the Committee on Research of the American Neuropsychiatric Association. Journal of Neuropsychiatry and Clinical Neurosciences, 18(4), 460–500. View source
- Use of normative databases and statistical methods in demonstrating clinical utility of QEEG: importance and cautions (2005). Clinical EEG and Neuroscience. View source
This article is general information, not medical advice. It doesn’t replace the guidance of your own doctor. If you have sudden or severe symptoms, contact your GP, NHS 111 or A&E.